Bees per Second (bps) Algorithm
The Eyesonhives Bee Activity patterns are variations of the number of bees flying in front of the hive, which become apparent by observing a beehive over the period of a day.
As the Eyesonhives Scout B device measures the number of flying bees in front of the hive “bees per second” or ‘bee flux’ using the team’s patented image processing algorithm, the data captures the hives’ behavior significantly differently than a traditional IR entrance gate counter.

Eyesonhives Daily Activity Patterns
Most surprising is that variations in the daily activity have now led to and understanding of signature activity patterns, related directly to the hive’s overall health and state.
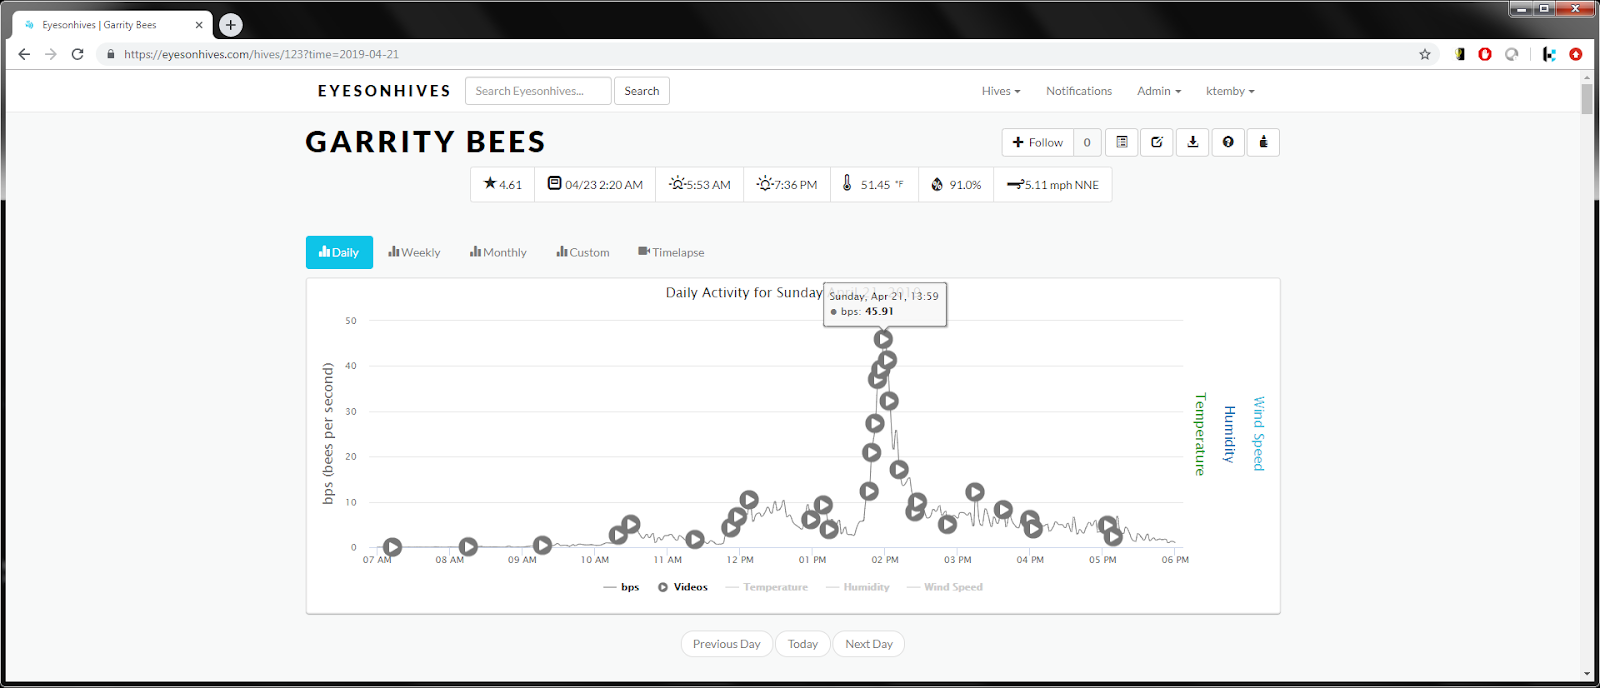
Orientation Signal
These signature patterns include new-bee orientation (new bees are related to queen health), swarming and robbing.
Why is Orientation important? Orientation in an established hive, is almost exclusively new bees flying back and forth, learning where they live. Therefore we can think of orientation as an indicator of new bees, which are an indicator of hatching brood, and therefore a queenright colony! See details in this post https://info.eyesonhives.com/the-orientation-signal-the-pattern-of-beehive-health/
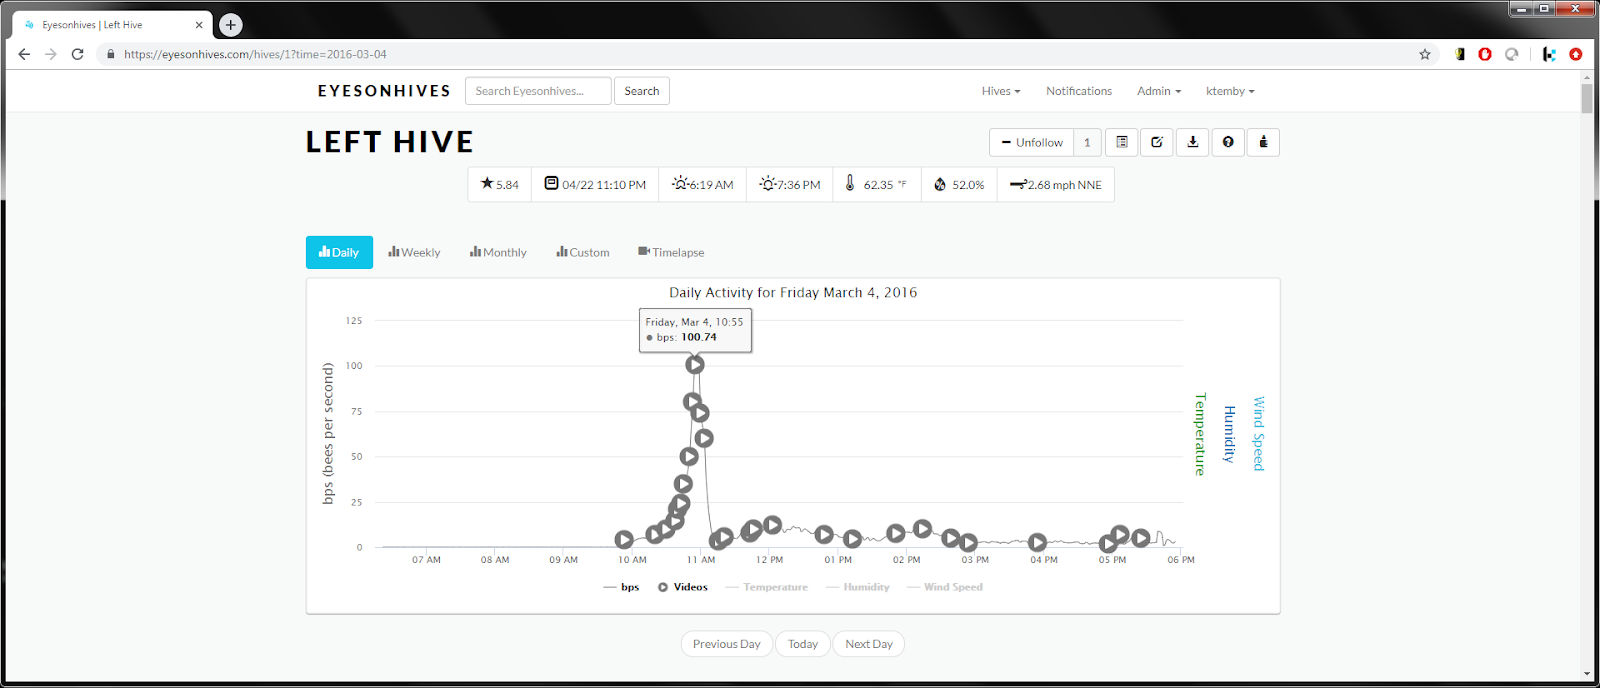
Swarming Signal
Since there’s video behind the data, it’s easy for beekeepers to literally see what’s going on for themselves too.
The ‘Swarming Signal’ is distinctive in that it is much larger in magnitude, and generally occurs in the morning, when compared to orientation activity spikes. See the details of the Swarming Signal is this post https://info.eyesonhives.com/swarming-signal-detected-eyesonhives/

Robbing Signal
Why can’t bees be friends? The robbing signal looks like a ‘saw tooth’ waveform – there’s a ramp up in activity, and a very gradual ramp down. The videos often show bees fighting bees, and the timelapse often shows wax cappings on the landing board, as the robbers raid the hive.

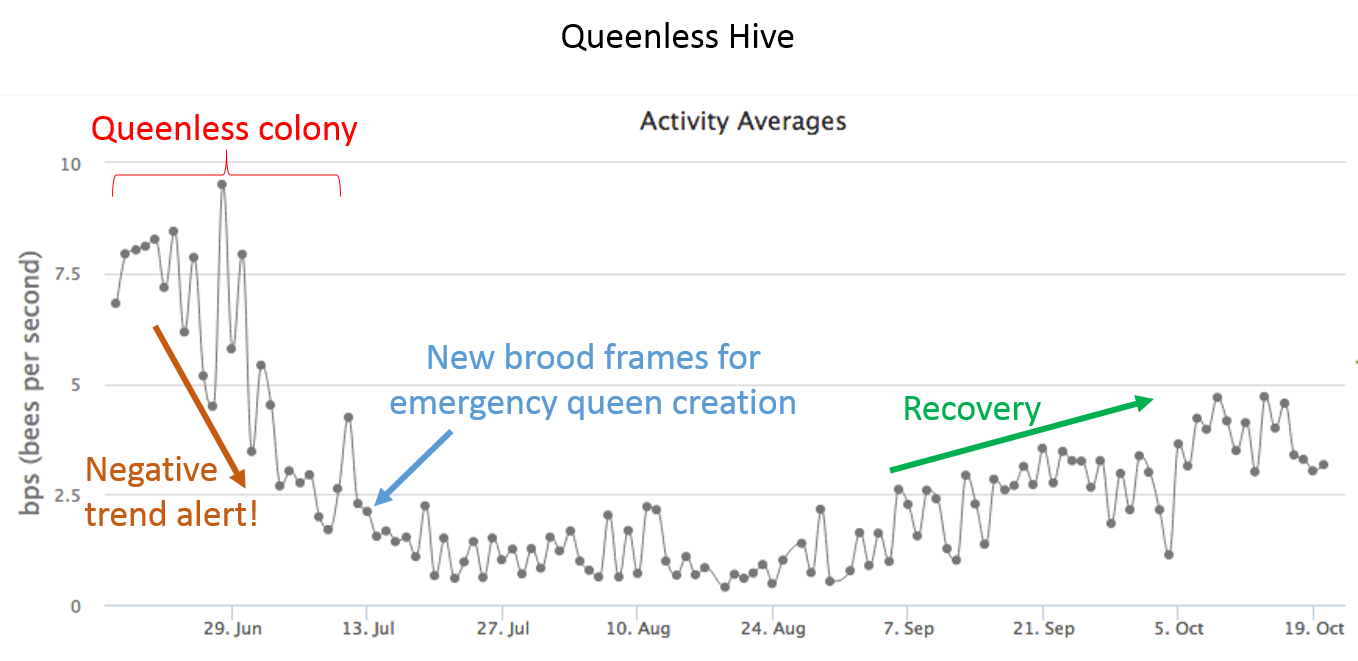
Long-Term Trends & A Queenless Hive
Eyesonhives helps beekeepers understand bee activity trends, and can objectively answer whether a hive is growing or in decline. This is particularly relevant when monitoring two hives within the same apiary, since seasonal and weather variations can be factored out.
Customer FAQ & Questions
What is the bees per second metric? Is it a count of flying bees only, or hovering, or moving bees?
Bees generally need to be flying, moving or hovering in any instant to be detected by the Eyesonhives algorithm. Simplified, the algorithm estimates ‘how many bees are seen in this video frame’. Each video typically is recording at 30 frames per second.
Is the count an average or sum of multiple detections over one second?
The count is an average of how many bees were seen per frame over the duration of each sample video.
Are multiple observations are averaged over some time interval?
The observations correspond to the average number of bees per second observed over the sample video duration. The duration is typically 29 seconds, and Eyesonhives by default records a sample video every two minutes.